Environmental Fact Sheet 9: Incorporation of Bioavailability in the Sediment Compartment

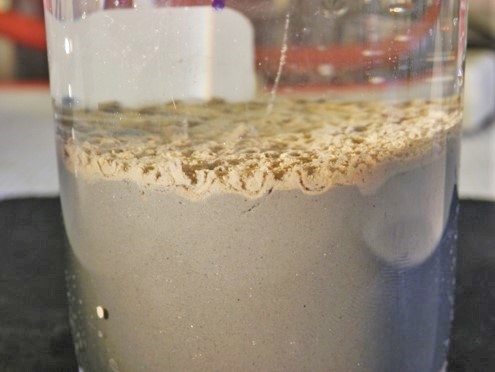
Cluster of live Tubifex worms, found in abundance in the mud of organically rich ponds


The Existing Substances Risk Assessment of Nickel was completed in 2008. The straightforward explanation of the goals of this exercise was to determine if the ongoing production and use of nickel in the EU caused risks to humans or the environment. The European Union launched the Existing Substances regulation in 2001 to comply with Council Regulation (EEC) 793/93. “Existing” substances were defined as chemical substances in use within the European Community before September 1981 and listed in the European Inventory of Existing Commercial Chemical Substances. Council Regulation (EEC) 793/931 provides a systematic framework for the evaluation of the risks of existing substances to human health and the environment.

The conceptual approach to conducting the environment section of the EU risk assessment of nickel included the following steps (Figure 1):

  • Emissions of nickel and nickel compounds to the environment were quantified for the whole life cycle, i.e. from production, use, and disposal;

  • Concentrations of nickel resulting from these emissions were determined in relevant environmental media (water, sediment, soil, tissue) at local and regional scales (PECs);

  • Critical effects concentrations (PNECs) were determined for each of the relevant environmental media;

  • Exposure concentrations were compared to critical effects concentrations for each of the relevant environmental media (risk characterization); and

  • Appropriate corrective actions (also described as risk management) were identified for situations where exposure concentrations were greater than critical effects concentrations. Where exposure concentrations were below critical effects concentrations, there was no need for concern or action.

The initial EU Risk Assessments for Nickel and Nickel Compounds were developed over the period from 2002 to 2008 but the European Commission identified some remaining data gaps with respect to the sediment compartment (Official Journal of the European Union 2008). Therefore, a multilaboratory, multiphase research project was conducted to provide a scientific basis for a bioavailability based approach for assessing risks of nickel in sediments. The laboratory testing initiative was conducted in three phases to satisfy the following objectives:

  1. evaluate various methods for spiking sediments with nickel to optimize the relevance of sediment nickel exposures;
  2. generate reliable ecotoxicity data by conducting standardized chronic ecotoxicity tests using 10 benthic species in sediments with low and high nickel binding capacity; and
  3. examine sediment bioavailability relationships by conducting chronic ecotoxicity testing in sediments that showed broad ranges of acid volatile sulfides, organic carbon, and iron.

A subset of 6 nickel-spiked sediments was deployed in the field to examine benthic colonization and community effects. The sediment testing program yielded a broad, high quality data set that was used to develop a Species Sensitivity Distribution (SSD) for benthic organisms in various sediment types, a reasonable worst case predicted no-effect concentration for nickel in sediment (PNECsediment), and predictive models for bioavailability and toxicity of nickel in freshwater sediments (Schlekat et al., 2016).

last revision: April 2018

Environmental risks are typically characterized in the risk assessment framework by comparing exposure concentrations and critical effect concentrations. In Organisation for Economic Cooperation and Development (OECD) countries, critical effect concentrations for metals are based on Predicted No Effect Concentrations (PNEC), which are typically derived from long-term laboratory-spiked ecotoxicity tests performed with highly soluble, almost completely dissociated metal salts in artificial laboratory standard sediments or natural sediments. It has been recognized that results from these whole sediment tests may be influenced by several parameters (e.g., sediment composition, spiking method, feeding mode, bioavailability) and that caution is needed in selecting and developing the appropriate test methods. For example, traditional sediment spiking methods that involve adding soluble nickel metal salts to sediments without further pH amendment result in significant diffusion of nickel from the sediment compartment to the water compartment (Vandegehuchte et al., 2007). During 2011-2015, a multi-laboratory, multiphase research project was conducted to address this issue (i.e. unrealistic high exposure conditions) and to provide a scientific basis to derive a bioavailability based approach for assessing risks of nickel (Ni) in sediments (Schlekat et al., 2016). Besides developing new spiking procedures (Brumbaugh et al., 2013), the nickel sediment research program demonstrated that the chronic toxicity of nickel in sediments was influenced by several physicochemical characteristics of the tested sediments, with the highest toxicity found in sediments with low Acid Volatile Sulfides (AVS) concentrations, low Total Organic Carbon (TOC), low total recoverable iron (Fe), and low Cation Exchange Capacity (CEC) (Besser et al., 2013; Vangheluwe et al., 2013; Vangheluwe and Nguyen, 2015). Therefore, nickel toxicity can vary considerably among sediments with different physico-chemical characteristics and tests with the same sediment species that are performed using different sediment types can produce different results. Consequently, bioavailability models were developed to directly compare sediment toxicity and to generate sediment threshold values, e.g., PNECsed.

This fact sheet provides an overview of the nickel sediment bioavailability models and demonstrates how this information can be used to estimate site-specific bioavailable nickel PNEC values. The availability of sediment physico-chemistry data, such as AVS content, allows site-specific nickel PNEC values to be calculated and a more accurate site-specific risk characterization to be conducted.

Bioavailability and chronic toxicity of nickel to sediment organisms varies based on sediment characteristics. To make comparisons between laboratory toxicity data, results must be normalized to a common set of conditions using bioavailability models. Bioavailability models can be used to derive site-specific HC5/PNEC values for sites in which appropriate sediment properties have been quantified. For nickel, chronic sediment toxicity tests are available for 10 species of sediment dwelling organisms conducted in nickel-spiked sediments representing sediments with low and high nickel binding capacity (i.e. low AVS/Low TOC and high AVS/high TOC) (See Fact Sheet 8). In addition, chronic toxicity tests were conducted with several additional nickel-spiked sediments with a wide range of AVS and TOC concentrations to characterize relationships for 7 test species between nickel toxicity and sediment characteristics (i.e. bioavailability regression models) (Besser et al., 2013; Vangheluwe and Nguyen, 2015; Vangheluwe et al., 2013). The chronic regression models for nickel were developed/calibrated based on sediments that represent the full range in physico-chemical parameters (AVS, OC) representative for the EU. EC20 values, expressed as either total recoverable nickel or SEMnickel, showed significant relationships with a range of sediment parameters, including AVS, total recoverable iron, TOC, CEC, silt, total recoverable manganese, and SEMmanganese. The importance of sediment phases other than AVS indicates that the relationships should be relevant for oxic sediments as well as anoxic sediments. For all species tested, the sediment parameter showing the strong-est linear relationship was AVS. AVS has already been demonstrated as being one of the predominant factors controlling toxicity of divalent metals (Di Toro et al., 1992; Ankley et al., 1991 and 1996). An overview of the slopes and intercepts of all significant regression models relating the toxicity of nickel ([Ni] in mg/kgdw) to AVS in sediments is presented in Table 1.

Although the effect of decreasing toxicity with increasing AVS was consistently observed for all species, the magnitude of the effect was not similar among species, and these differences appear to be linked with organism behavior. The strongest mitigating effects of AVS are observed for those species with an epibenthic lifestyle such as H. azteca, S. corneum, and G. pseudolimnaeus, with slopes ranging from 0.358 to 0.492 (Table 1). The relationships are less pronounced for the benthic species T. tubifex, C. riparius, Hexagenia sp., and E. virgo that exhibit more burrowing activity and subsurface feeding (i.e. slopes ranging from 0.125-0.22).

The empirically based regression models predicting nickel toxicity in spiked sediments based on sediment properties can be used to normalize the available toxicity data set to specific bioavailability conditions. For example, a Realistic Worst Case (RWC) PNEC can be derived by recalculating the nickel sediment toxicity database toward a reference situation, such as 10th percentile of the regional AVS/ distribution, in case no actual or historical AVS data are available.  Alternatively, a PNEC can be derived for the actual AVS concentrations occurring at the site as follows:

  1. Link the NOEC/ECX values of the chronic ecotoxicity database (as total metal concentrations) with the relevant sediment parameters of the sediment (e.g., AVS) in which the test was performed.
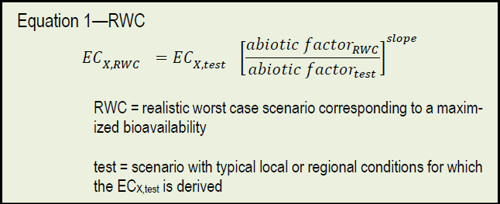
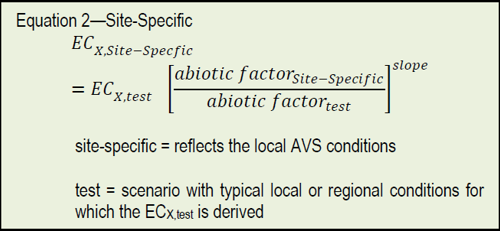
  2. For the regression models [taking the form log(ECx) = intercept + slope * log(abiotic factor)], the corresponding organisms specific slopes can be used to normalize the NOEC/ECX values to “reasonable worst case” sediment properties (e.g., 10th percentile AVS) or to specific local/regional conditions (actual or historical AVS concentrations prevailing on the site under investigation). The normalization equations for RWC and site-specific conditions are given below in Equations 1 and 2.

The different bioavailability models have been used to normalize the final toxicity dataset to nine different bioavailability scenarios (eight specific sediments ranging from low to high AVS content and one hypothetical RWC condition). The different sediments are described in the paper of Vangheluwe et al. (2013). Bioavailability models are available for seven species. For all the derived EC10 values the oligochaete L. variegatus is the only test organism without a specific bioavailability model, and hence, this is the only data point in the Species Sensitivity Distribution (SSD) for which the bioavailability model for another species needs to be used. The choice of the model to use for L. variegatus was based on biological and practical considerations, including similarities in life history and behavior with other species for which bioavailability models were established, and the degree to which different bioavailability models reduced observed intra-species variability for L. variegatus. Oligochaetes such as L. variegatus alter their immediate environment through the formation of I-shaped burrows. Tubificids live in a similar way head-down in relatively permanent vertical burrows feeding on deposits on some depth. In contrast with Hexagenia, the micro-habitats of oligochaetes are not irrigated with oxygenated water; nevertheless, this behavior will minimize the mitigating capacity of a bioavailability factor such as AVS as reflected in the smaller slope of the AVS model developed for Hexagenia and T. tubifex. Because of the close similarity between tubificid/oligochaete worm behavior the T. tubifex model is used to normalize the L. variegatus data. This choice is considered precautionary as it has the smallest slope of all species tested (i.e. 0.125). Species to species "read across,” however, may introduce additional uncertainty. Figure 2 represents the lognormal functions normalized for AVS that were fitted through the eight data points for eight sediments and the RWC. All functions were accepted at P < 0.05.

A summary of the estimated HC5-50 values (with the 5-95% confidence limits) for the different log-normal distributions is provided in Table 2. The HC5-50 values obtained for the different bioavailability scenarios range with the AVS model from 109-305 mg/kg dry wt. The PNEC was calculated as the HC5-50 multiplied by an AF (assessment factor) of 1.

4.1 AVS databases

To apply an AVS normalization, a good understanding of the amount and geographical distribution of AVS in sediments is needed. AVS concentrations are not yet measured on a routine basis in sediment monitoring programs but some data have been collected on the AVS distribution in different countries within the context of metal risk assessments where the SEM-AVS concept has been used. An overview of AVS ranges that are typically encountered in sediment is given per country in Figure 3 as Box-Whisker plots. A box and whisker diagram, or boxplot, provides a graphical summary of a set of data based on the quartiles of that data set. The ‘box,’ or rectangle, in Figure 3 contains 50% of the data, and the extremes of that box are the 25th percentile and 75th percentile. Each ‘whisker’ represents the remaining 25% of the data and the extremities of these whiskers are the minimum and maximum values of the data.

The largest database available is for the Flanders region of Belgium. This database, which is representative for EU low midland rivers, contains 200 sediments sampled over a depth of 0-10 cm. The 50th percentile of the AVS distribution yields an AVS value of 8.7 µmol/g dry wt. (Vangheluwe et al., 2005). The lowest AVS concentration in the Flanders dataset is 0.045 µmol/g dry wt. The 10th percentile is 0.77 µmol/g dry wt. The latter value has been used in the different ongoing metal risk assessments to be used as a generic default correction value for low midland rivers (the Netherlands, Germany, and possibly Northern France) when site-specific measurements are lacking.

In 2008, three additional countries were sampled: Finland, United Kingdom, and Spain (Vangheluwe et al., 2008). Although the intention was to sample in the spring season (April-May) when AVS concentrations are expected to be the lowest, this was only possible for Finland. In the United Kingdom, sampling was conducted in June-September and Spain in October. In Finland, a total of 25 samples were taken (13 lakes, 12 rivers). Analysis of the AVS concentrations gives a 10th percentile of 1 µmol/g dry wt. and a 50th percentile of 11 µmol/ g dry wt. The lowest concentration measured was 0.3 µmol/g dry wt. For the United Kingdom, 16 sediments from 16 different rivers were sampled. Analysis of the AVS concentrations gives a 10th percentile of 0.31 µmol/g dry wt. and a 50th percentile of 7.95 µmol/ g dry wt. The lowest concentration measured was 0.071 µmol/g dry wt. For Spain, 20 samples of the river Ebro were sampled. Analysis of the AVS concentrations gives a 10th per-centile of 3.68 µmol/g dry wt. and a 50th percentile of 13.5 µmol/ g dry wt. The lowest AVS concentration measured was 1.7 µmol/g dry wt.

Burton et al. (2007) investigated AVS concentrations for 84 sites in wadable streams of 10 countries and nine ecoregions of Europe. The results showed AVS concentrations ranging from 0.004 µmol/g dry wt. to 44 µmol/g dry wt. with a median value of 0.1 µmol/g dry wt. (sample depth 0-5 cm) and an average value of 2.5 µmol/g dry wt. It should be noted that sediments in this program were collected in head streams resulting in very low AVS and SEM levels.

4.2 Sediment sampling recommendations

The use of AVS is sometimes criticized because of the dynamic behavior of AVS in natural systems. AVS concentrations have shown temporal and spatial (horizontal and vertical) variations depending on sediment type and hydrological conditions (Poot et al., 2007). Most often the AVS concentration increases with increasing sediment depth (even over small sample distances 0-10 cm) and is linked to the redox gradient present in the sediment (Van Den Berg et al., 1998; Van Den Berg et al., 2001a, 2001b). In addition, there seems to be a strong seasonal component where AVS concentrations tend to be the higher at the end of the summer and during fall and lower in winter and spring (Howard and Evans, 1993; van den Hoop et al., 1997; Grabowski et al., 2001). However, it should be noted that transient nature of AVS in this regard maybe overstated as most of the studies relate to uncontaminated sediments where the oxidation of iron sulfide in sediments cannot be taken as indicative of the oxidation of the other metal sulfide complexes, which are more stable [e.g., copper, zinc, cadmium sulfide (Peterson, 1996) and nickel sulfide (Buykx et al., 2000)].

Despite the higher stability of nickel sulfide complexes, both temporal and spatial variations are important to be considered when collecting SEM-AVS data. As AVS concentrations have the tendency to be lower in spring and winter than in summer, it is recommended to sample sediments late winter/early spring. Furthermore, it is recommended to sample the top layer (0-5 cm) as AVS concentrations are lower than those found in the deeper layers (> 10 cm) (Van Den Berg et al., 1998; De Lange et al., 2008). As such, realistic worst case exposure conditions are guaranteed to conduct bioassays.

4.3 Analytical measurements

Acid volatile sulfide is defined operationally as those sulfides that are readily extracted by the cold extraction of sediment in approximately 1 molar HCl acid (Allen et al., 1993). Another term that is used in conjunction with AVS is SEM. SEM (Simultaneously Extracted Metal) can be defined as the metal, which is simultaneously extracted under the same conditions under which the AVS content is determined. AVS is a complex and variable fraction represented by a variety of reduced sulfur components, although often dominated by relatively labile iron and manganese monosulfides (Morse, 2004). In the past multiple techniques, employing different chemical reagents and methodologies have been used to extract AVS from sediment. As the efficiency of sulfide extraction from minerals including pyrite varies amongst methods different results can be expected from these measurements. In part to promote a greater inter-comparability of AVS and SEM results extraction with 1 molar HCl has been proposed (Allen, 1991). Nevertheless, it has been shown by Hammerschmidt and Burton (2010) that caution is needed to interpret results that lack well described quality control procedures which may lead to a high variability among laboratories. This was even more apparent in cases where sediments with low AVS concentrations (< 0.5 µmol/ g dry wt.) were used. However, recently Brumbaugh et al. (2011) has shown, in an interlaboratory comparison of measurements of Acid Volatile Sulfide and Simultaneously extracted nickel in spiked sediments, that measurements of AVS and SEM-AVS can be reproducible among different laboratories when performed with structured analytical guidelines.

Figure 4 represents the tiered approach that can be used to refine the risk assessment using the SEM-AVS concept.

No risk is identified when the total nickel concentration is smaller than the RWC PNEC. This PNEC for nickel can be derived using sediments high in bioavailability (see Fact Sheet 8).

If a risk is identified and historical AVS data are available for the receiving water or river/lake systems similar in characteristics these data can be used to calculate the PNEC AVS normalized using the available nickel bioavailability models.

The risks for the local site can subsequently be calculated from the comparison between the PECTotal and the PNECAVS normalized, site specific (Equation 3).

The actual risk can be calculated using actual measured SEM-AVS concentrations for the site under investigation.

Total SEMsite specific – AVSsite specific < 0 no risk
Total SEMsite specific – AVSsite specific > potential risk

In case SEM-AVS > 0 a further weight of analysis can be conducted (e.g., direct toxicity testing, macro-invertebrate analysis etc.).

When considering nickel toxicity in sediments, it is important to account for sediment bioavailability. Bioavailability models based on AVS binding have subsequently been developed to normalize nickel ecotoxicity data to a common site condition when deriving HC5/PNECs or sediment standards. This fact sheet presents the background information on the available sediment nickel bioavailability models and demonstrates how this information can be used to estimate site-specific bioavailable PNEC values. The availability of sediment physico-chemistry data, such as AVS content can be limited in some cases but sampling analyzing AVS concentrations can be done in a reproducible way allowing site-specific PNEC values to be calculated and a more accurate site-specific risk characterization to be conducted. However, the sole use of the SEM-AVS concept for nickel is conservative as it has been demonstrated that even in the absence of AVS, as is the case in oxic sediments, other partitioning phases such as binding to iron and manganese oxides may mitigate nickel toxicity in sediments (Costello et al., 2011).

The final report on the environmental risk assessment of nickel and nickel compounds can be retrieved from the following website: http://echa.europa.eu/documents/10162/cefda8bc-2952-4c11-885f-342aacf769b3 (last accessed April 2018)

Allen, H.E.; Fu, G.; Boothman, W.; DiToro, D.; Mahony, J.D. 1991. Draft analytical method for determination of acid volatile sulfide in sediment. U.S. Environmental Protection Agency. Washington, DC.

Allen, H.E.; Fu, G.; Deng, B. 1993. Analysis of acid-volatile sulfide (AVS) and simultaneously extracted metals (SEM) for the estimation of potential toxicity in aquatic systems. Environmental Toxicology and Chemistry 12: 1441-1453.

Ankley, G.T.; Phipps, G.L.; Leonard, E.N.; Benoit, D.A.; Mattson, V.R.; Kosian, P.A.; Cotter, A.M.; Dierkes, J.R.; Hansen, D.J.; Mahony, D.J. 1991. Acid Volatile sulfide as a factor mediating cadmium and nickel bioavailability in contaminated sediments. Environmental Toxicology and Chemistry 10: 1299-1307.

Ankley, G.T.; Di Toro, D.M.; Hansen, D.J.; Berry, W.J. 1996. Technical basis and proposal for deriving sediment quality criteria for metals. Environmental Toxicology and Chemistry 15(2): 2056-2066.

Besser, J.M.; Brumbaugh, W.G.; Ingersoll, C.G.; Ivey, C.D.; Kunz, J.L.; Kemble, N.E.; Schlekat, C.E.; Garman, E.R. 2013. Chronic toxicity of nickel-spiked freshwater sediments: Variation in toxicity among eight invertebrate taxa and eight sediments. Environmental Toxicology and Chemistry 32: 2495-2506.

Brumbaugh, W.G.; Hammerschmidt, C.R.; Zanella, L.; Rogevich, E.; Salata, G.; Bolek, R. 2011. Interlaboratory comparison of measurements and Acid-Volatile Sulfide and Simultaneously Extracted Nickel in spiked sediments. Environmental Toxicology and Chemistry 30(6): 1306-1309.

Brumbaugh, W.G.; Besser, J.M.; Ingersoll, C.G.; May, T.W.; Ivey, C.D.; Schlekat, C.E.; Rogevich-Garman, E. 2013. Nickel partitioning during chronic laboratory toxicity tests with eight different spiked freshwater sediments: Toward more environmentally realistic testing conditions. Environmental Toxicology and Chemistry 32: 2482–2494.

Burton, G.A.; Green, A.; Bauso, R.; Forbes, V.; Nguyen, L.T.; Janssen, C.R.; Kukkonen, J.; Leppanen, M.; Maltby, L.; Soares, A.; Kapo, K.; Smith, P.; Dunning, J. 2007. Characterizing sediment acid volatile sulfide concentration in European streams. Environmental Toxicology and Chemistry 26(1): 1-12.

Buykx, S.E.J.; Bleijenberg, M.; van den Hoop, M.A.G.T.; Loch, J.P.G. 2000. The effect of oxidation and acidification on the speciation of heavy metals in sulfide-rich freshwater sediments using a sequential extraction procedure. Journal of Environmental Monitoring 2: 23-27.

Costello, D.M.; Burton, G.A.; Hammerschmidth, C.R.; Rogevich, E.C.; Schlekat, C.E. 2011. Nickel phase partitioning and toxicity in field deployed sediments. Environmental Science and Technology 45(13): 5798-57805.

De Lange, H.J.; Van Griethuysen, C.; Koelmans, A.A. 2008. Sampling method, storage and pretreatment of sediment affect AVS concentrations with consequences for bioassay responses. Environmental Pollution 151: 243-251.

Di Toro, D.M.; Mahony, J.D.; Hansen, D.J.; Scott, K.J.; Carlson, A.R., Ankley, G.T. 1992. Acid volatile sulfide predicts the acute toxicity of cadmium and nickel in sediments. Environmental Science Technology 26: 96-101.

Grabowski, L.A.; Houpis, J.L.J.; Woods, W.I.; Johnson, K.A. 2001. Seasonal bioavailability of sediment-associated heavy metals along the Mississippi river flood plain. Chemosphere 45: 643-651.

Hammerschmidt, C.R.; Burton, G.A. 2010. Measurements of acid volatile sulfide and simultaneously extracted metals are irreproducible among laboratories. Environmental Toxicology and Chemistry 29(7): 1453-1456.

Howard, D.E.; Evans, R.D. 1993. Acid-volatile sulfide (AVS) in a seasonally anoxic mesotrophic lake: Seasonal and spatial changes in sediment AVS. Environmental Toxicology and Chemistry 12: 1051-1057.

Morse, J.W. 2004. Chemical dynamics of sedimentary acid volatile sulfide. Environmental Science and Technology 1(38) 7:131-136.

Peterson G.S., Anklet, G.T.; Leonard, E.N. 1996. Effect of bioturbation on metal-sulfide oxidation in surficial freshwater sediments. Environmental Toxicology and Chemistry 15(12): 2147-2155.

Poot, A.; Gillssen. F.; Kolemans, A.A. 2007. Effects of flow regime and flooding on heavy metal availability in sediment and soil of a dynamic river system. Environmental Pollution 148(3): 779-787.

Schlekat, C.E.; Garman, E.R.; Vangheluwe, M.L.; Burton, G.A. 2016. Development of a bioavailability-based risk assessment approach for nickel in freshwater sediments. Integrated Environmental Assessment and Management DOI: 10.1002/ieam.1720.

Van Den Berg, G.A.; Loch, J.P.; Van Der Heijdt, L.M.; Zwolsman, J.G. 1998. Vertical distribution of acid volatile sulfide and simultaneously extracted metals in a recent sedimentation area of the river Meuse in the Netherlands. Environmental Toxicology and Chemistry 17(4): 758-763.

Van den Berg, G.A.; Buykx, S.E.J.; Van Den Hoop, M.A.G.T.; Van Der Heijdt, L.M.; Zwolsman, J.J.G. 2001a. Vertical profiles of trace metals and acid-volatile-sulfide in a dynamic sedimentary environment: Lake Ketel, The Netherlands. Applied Geochemistry 16: 781-791.

Van Den Berg, G.A.; Meijers, G.G.; Van Der Heijdt, L.M.; Zwolsman, J.J. 2001b. Dredging related mobilisation of trace metals: a case study in the Netherlands. Water Research 35(8): 1979-1986.

Van den Hoop, M.A.G.T.; den Hollander, H.A.; Kerdijk, H.N. 1997. Spatial and seasonal variations of acid volatile sulphide (AVS) and simultaneously extracted metals (SEM) in Dutch marine and freshwater sediments. Chemosphere 35(10): 2307-2316.

Vandegehuchte, M.B.; Roman, Y.E.; Nguyen, L.T.; Janssen, C.R.; De Schamphelaere, K.A. 2007. Toxicological availability of nickel to the benthic oligochaete Lumbriculus variegatus. Environmental International 33: 736-742.

Vangheluwe 2005. Discussion document on the selection of an AVS default value representative for the EU region, 25th November 2005.

Vangheluwe, M.; Verdonck, F.; Heijerick, D.; Shtiza, A.; Burtin, A.; Taulbee K.; Boucard, T.; Mäkinen, J.; Gonzales, E. 2008. Acid volatile sulfide survey of large river and/or lake sediments in the United Kingdom (England and Wales) Spain and Finland in 2007. ARCHE Consulting. Final report September.

Vangheluwe, M.L.U.; Verdonck, F.A.M.; Besser, J.M.; Brumbaugh, W.G.; Ingersoll, C.G.; Schlekat, C.E.; Garman, E.R. 2013. Improving sediment quality guidelines for nickel: Development and application of predictive bioavailability models to assess chronic toxicity of nickel in freshwater sediments. Environmental Toxicology and Chemistry 32: 2507-2519.

Vangheluwe, M.; Nguyen L. 2015. Advanced research on nickel toxicity in sediments: results additional species and modeling. Final Report. Durham (NC): Nickel Producers Environmental Research Association.
Back to top