2.1 Data generation and compilation
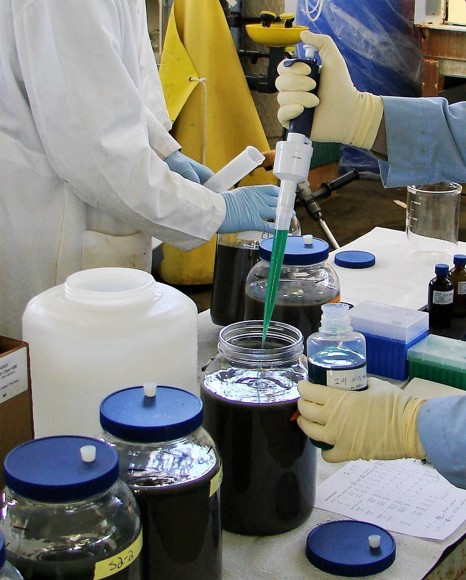
Traditional sediment spiking methods, whereby soluble metal salts are added to sediments without further amendment, causes hydrolysis that results in a decrease in pore water pH and fosters significant metal release from the sediment compartment to the water compartment. To resolve this issue, new spiking procedures needed to be developed in order to generate scientifically sound toxicity data for the sediment compartment. Researchers at the United States Geological Survey (USGS) developed a two-step method for spiking nickel into freshwater sediments to create spiked sediments that were more representative of natural sediments gradually contaminated with nickel (Brumbaugh et al., 2013). The two-step approach required adding high concentrations of soluble NiCl2 to sediments followed by an immediate pH adjustment with NaOH to mitigate the effects of hydrolysis. The product of the first step, referred to as a “super-spike,” was equilibrated for four weeks. After this equilibration period, the super-spike sediment was diluted with clean sediment and equilibrated for six additional weeks to create gradients of sediment nickel concentrations that were used in sediment toxicity tests.
For sediment risk assessment, standardized sediment toxicity test protocols are available for only a small number of taxonomic groups. Also, no sediment-specific guidance is available on the number of species and taxonomic groups that are needed to represent an adequate database of benthic species for the determination of reliable sediment effects thresholds. The approach taken for the nickel sediment toxicity research project was to use as many species as possible considering a reliable test methodology was available. The REACH regulation risk assessment approaches are based on chronic ecotoxicity data, so only chronic toxicity tests were conducted. The chronic sediment effects data were generated by conducting toxicity tests with 10 benthic species with 8 nickel-spiked natural sediments representing sediments with a range of low to high nickel binding capacity. The ultimate nickel ecotoxicity database included amphipods (H. azteca, G. pseudolimnaeus), mayflies (Hexagenia sp., Epheron virgo), oligochaetes (T. tubifex, L. variegatus), mussels (L. siliquoidea, S. corneum), and midges (C. dilutus, C. riparius) and is representative of different sediment exposure pathways, as well as a variety of feeding strategies and taxonomic groups representative of benthic ecosystems.
Full details on spiking procedures and the nickel sediment toxicity database can be found in Brumbaugh et al. (2013), Besser et al. (2013), Vangheluwe et al. (2013), Schlekat et al. (2016), and Vangheluwe and Nguyen (2015). Field studies using the same spiking procedures were also performed. Results of these studies showed that results from laboratory tests are protective of ecological-level effects in complex natural systems (Costello et al., 2011).
2.2 Data quality screening
Each individual ecotoxicity data point was screened for quality before incorporation in the nickel ecotoxicity database based on the criteria listed below, taking into account some recommendations of the ECHA sediment workshop (ECHA, 2014)1.
- Data were retained for the following groups of organisms: crustaceans (amphipods), insects, oligochaetes, and molluscs.
- Data covered the following relevant endpoints: survival, growth (biomass), reproduction (abundance), and emergence.
- Data covered relevant feeding habits and ecological niches: burrowers, subsurface feeders, surface deposit feeders, and swimmers/sprawlers.
- Toxicity tests were conducted in natural (field collected) sediments spiked with nickel only.
- The results reported measured Acid Volatile Sulphides (AVS), Total Organic Carbon (TOC), iron (Fe), Cation Exchange Capacity (CEC), nickel, and metals.
- The range of the physico-chemistry of the test media (AVS, iron) were within the range of the concentrations found in natural sediments.
- The data were from studies conducted according to approved international standard test guidelines with a detailed description of the methods employed during toxicity testing, however, data following non-standardized tests protocols were also generated.
- Only long-term or chronic toxicity data were used, involving endpoints that are realized over periods of several weeks (typically 28 days) depending on the organism.
- Preference was clearly given to the use of measured nickel concentrations in the test concentrations.
- A clear concentration-response was observed.
- Toxicity threshold values calculated as L(E)C10 and L(E)C20 (the concentration that causes 10 or 20% effect during a specified time interval) values were calculated.
- The toxicity tests were performed with soluble nickel salts (e.g., NiCl2).
- The toxicity data were related to the total concentration of nickel in sediments and the test results were expressed as mg Ni/kg dry weight.
- Ecotoxicity threshold values were derived using the proper statistical methods.
Ecotoxicity data had to fulfill these criteria to be used for the freshwater sediment PNEC derivation.
2.3 Incorporation of bioavailability (data normalization)
The assessment of risks from metals in the sediment compartment is often hampered by the fact that no clear relationship has been established between measured total concentrations of metals in sediments and their potential to cause toxic effects on aquatic life (Di Toro et al., 1992). As a result, comparing total concentrations expressed on a dry or wet weight basis without taking bioavailability into account with an established threshold concentration has the potential to result in an under or overestimation of the associated risk. Normalization to similar conditions are necessary to make meaningful comparisons.
The chronic toxicity of nickel in sediments within the nickel sediment research program was influenced by several physico-chemical characteristics of the tested sediments, with the highest toxicity found in sediments with low AVS concentrations, low TOC, low total recoverable Fe, and low CEC. For all species tested, the sediment parameter showing the strongest line-ar relationship was AVS. AVS has already been demonstrated as being one of the predominant factors controlling toxicity of divalent metals (Di Toro et al., 1992; Ankley et al., 1991, 1996). Within the nickel research program, chronic toxicity tests were conducted with several nickel-spiked sediments with a wide range of AVS concentrations in order to characterize the bioavailability relationships between nickel toxicity and AVS concentration for seven test species (i.e. linear regression models) (Vangheluwe et al., 2013; Vangheluwe and Nguyen, 2015). These empirical relationships between sediment toxicity end-points and AVS concentration allow nickel ecotoxicity data to be normalized to different sediment scenarios (see example Section 3) and Figure 3.
Depending on the assessment (generic or local) the ecotoxicity data can be normalized to the targeted AVS concentration using the linear regression models developed for nickel (Vangheluwe et al., 2013; Vangheluwe and Nguyen, 2015). In order to derive a RWC PNEC the process of bioavailability normalization begins with the normalization of ecotoxicity values (e.g., EC10 values would be used for REACH) from each test to the target AVS concentrations [e.g., 0.8 mmol/kg dry weight for the RWC scenario (Vangheluwe et al., 2008)]. If a local assessment is conducted the typical AVS concentrations (median value) prevailing at a site can be used as normalization target. For further guidance on the available regression models for nickel see Fact Sheet 9.
For species that were tested in multiple sediments, the geometric mean of normalized ecotoxicity values should be calculated (see Section 2.4).
2.4 Data aggregation
Normalized high quality ecotoxicity data are grouped/aggregated in order to avoid over-representation of ecotoxicological data from one particular species. The following major rules were used to aggregate data:
- If several chronic L(E)C10 values based on the same toxicological endpoint were available for a given species, the values were averaged by calculating the geometric mean resulting in the “species mean” /L(E)C10.
- If several (geometric mean) chronic /L(E)C10 values based on different toxicological endpoints were available for a given species, the lowest (geometric value) value was selected.
After the data aggregation step, only one ecotoxicity value (i.e. the geometric mean for the most sensitive endpoint) was assigned to a particular species.
2.5 Calculation of PNEC using statistical extrapolation methods
Estimation of the HC5 from the species sensitivity distribution
When a large data set for different taxonomic groups is available, the PNEC can be calculated using a statistical extrapolation method. Recommendations for the minimum number of species to use with a species sensitivity distribution range considerably. No guidance, however, is available for what species would represent an adequate database of benthic invertebrates for the determination of a PNEC for sediment. Applying a species sensitivity distribution (SSD) for the sediment compartment should definitely take into account:
- the expected differences in species richness between sediment and water ecosystems;
- the different exposure conditions and feeding behaviors of the organisms in the sediment (ingestion of sediment, body wall contact, exposure through pore water and overlying water); and
- the limitation that very few standardized sediment toxicity test methods have been established for benthic species overall.
For nickel, a benthic database has been generated for 10 benthic species that are representative of different sediment exposure pathways, as well as a variety of feeding strategies and taxonomic groups. In short, this data set is representative of benthic ecosystems, thus fulfilling one of the characteristics that should be considered when evaluating whether or not the use of the species sensitivity distribution approach is appropriate.
In the SSD approach, the ecotoxicity data are ranked from low (most sensitive species) to high (least sensitive species) and a SSD is constructed by applying an appropriate distribution (usually a log-normal distribution) to the normalized chronic toxicity data (Aldenberg & Jaworska, 2000). From the SSD, a 5th percentile value (at the median confidence interval) is calculated (i.e. median HC5) using the software program ETx as described by Van Vlaardingen et al. (2004).
Selection of appropriate assessment factor and derivation of the PNEC
To account for uncertainty, REACH guidance allows for the application of an assessment factor (AF) to the median HC5. AFs vary between 1 and 5 and are determined on a case-by-case basis. The freshwater sediment PNEC is therefore calculated as follows:
Freshwater sediment PNEC = median HC5/AF
Based on the available chronic L(E)C10 data, the following factors were considered when determining the AF:
- the overall quality of the database and the end-points covered (e.g., are all the compiled data representative of “true” chronic exposure?);
- the diversity and representativeness of the taxonomic groups covered by the database [e.g., do the databases contain species representative of different sediment exposure pathways, as well as a variety of feeding strategies and taxonomic groups: a crustacean (e.g., amphipods) an insect (e.g., midge, mayfly), an olgochaete (e.g., tubificidae, lumbriculidae) and a family in any order of insect or any phylum not already presented (e.g., molluscs)];
- use of bioavailability models and approach for bioavailability correction [e.g., do the bioavailability models (see Fact Sheet 9) allow the toxicity data for all species to be normalized?];
- statistical extrapolation and uncertainties (e.g., how well does the SSD fit the toxicity data?); and
- comparisons between field studies and the PNEC (e.g., is the PNEC value protective for the effects observed in field studies?).
Given the robust database that includes nickel ecotoxicity data from both laboratory (Besser et al., 2013) and field (Costello et al., 2011) studies, and our increased knowledge on nickel geochemical behavior in sediments (Brumbaugh et al., 2013), an AF of 1 is justified.
1 The application of the quality screening criteria would also apply in case additional or new ecotoxicity data would be generated.

