Environmental Fact Sheet 7: Regional/Continental Point and Diffuse Emissions

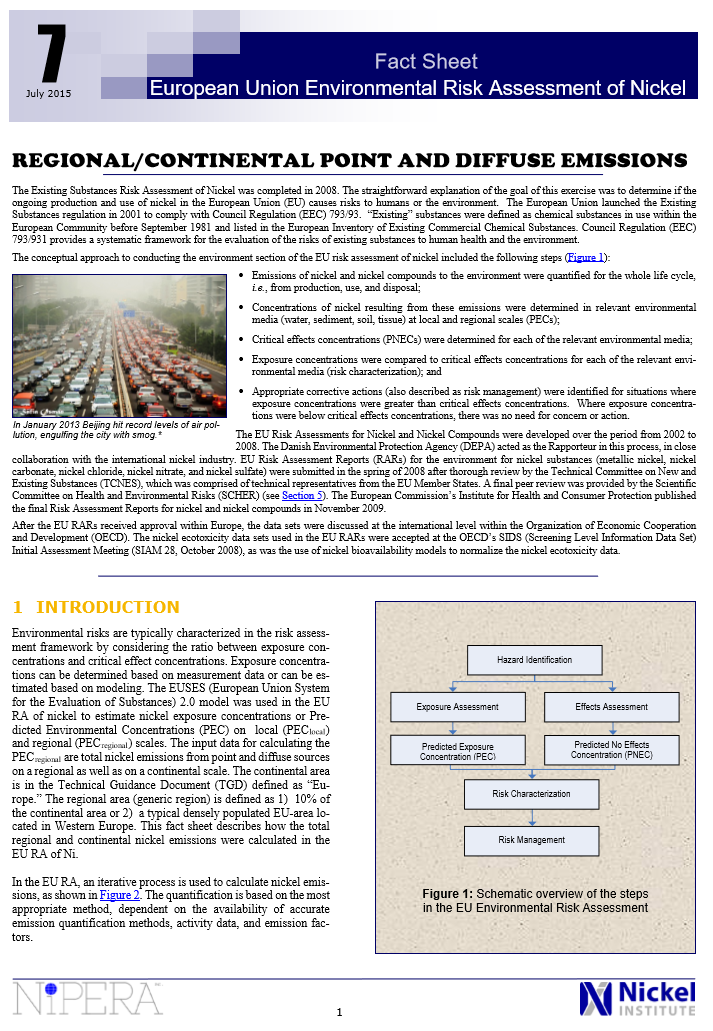
In January 2013 Beijing hit record levels of air pollution, engulfing the city with smog.*

The Existing Substances Risk Assessment of Nickel was completed in 2008. The straightforward explanation of the goal of this exercise was to determine if the ongoing production and use of nickel in the European Union (EU) causes risks to humans or the environment. The European Union launched the Existing Substances regulation in 2001 to comply with Council Regulation (EEC) 793/93. “Existing” substances were defined as chemical substances in use within the European Community before September 1981 and listed in the European Inventory of Existing Commercial Chemical Substances. Council Regulation (EEC) 793/931 provides a systematic framework for the evaluation of the risks of existing substances to human health and the environment.

The conceptual approach to conducting the environment section of the EU risk assessment of nickel included the following steps (Figure 1):

  • Emissions of nickel and nickel compounds to the environment were quantified for the whole life cycle, i.e., from production, use, and disposal;

  • Concentrations of nickel resulting from these emissions were determined in relevant environmental media (water, sediment, soil, tissue) at local and regional scales (PECs);

  • Critical effects concentrations (PNECs) were determined for each of the relevant environmental media;

  • Exposure concentrations were compared to critical effects concentrations for each of the relevant environmental media (risk characterization); and

  • Appropriate corrective actions (also described as risk management) were identified for situations where exposure concentrations were greater than critical effects concentrations. Where exposure concentrations were below critical effects concentrations, there was no need for concern or action.

The EU Risk Assessments for Nickel and Nickel Compounds were developed over the period from 2002 to 2008. The Danish Environmental Protection Agency (DEPA) acted as the Rapporteur in this process, in close collaboration with the international nickel industry. EU Risk Assessment Reports (RARs) for the environment for nickel substances (metallic nickel, nickel carbonate, nickel chloride, nickel nitrate, and nickel sulfate) were submitted in the spring of 2008 after thorough review by the Technical Committee on New and Existing Substances (TCNES), which was comprised of technical representatives from the EU Member States. A final peer review was provided by the Scientific Committee on Health and Environmental Risks (SCHER) (see Section 5). The European Commission’s Institute for Health and Consumer Protection published the final Risk Assessment Reports for nickel and nickel compounds in November 2009.

After the EU RARs received approval within Europe, the data sets were discussed at the international level within the Organization of Economic Cooperation and Development (OECD). The nickel ecotoxicity data sets used in the EU RARs were accepted at the OECD’s SIDS (Screening Level Information Data Set) Initial Assessment Meeting (SIAM 28, October 2008), as was the use of nickel bioavailability models to normalize the nickel ecotoxicity data.


*    Some rights reserved by photographer Safia Osman http://www.flickr.com/photos/so8/8161891893/sizes/h/in/photolist-dreQ72-cAqR8q-mKRHP-yhBjF-dNmAvF-e3sRdV-75yL2T-8Kxvqv-e9U2FQ-3dNdk8-6wKpKd-9G6Yig-3FMJyY-8yCPky-8ASuK4-5bJUX9-4xbcay-cGQxXo-5bECwe-4WwjLV-85M9s6-5SGoK-6SCr3L-4ik3Tn-d4SkrC-5GfPd-29q76c-5bhrUY-ahtoft-aqPKpc-br1hAC-bdhD6-3kQnEa-5eCiaw-5eCifu-a7HxNK-9DnUVo-axXLQ1-a7Lr1j-4VbwST-549DjK-psDeG-7dzfL4-4ESjFL-3gwUwM-8SP5M9-2tVX7c-2u1pm1-cGejvm-pDP3w-3wpbaq/ (last accessed September 2013)


last revision: July 2015

Environmental risks are typically characterized in the risk assessment framework by considering the ratio between exposure concentrations and critical effect concentrations. Exposure concentrations can be determined based on measurement data or can be estimated based on modeling. The EUSES (European Union System for the Evaluation of Substances) 2.0 model was used in the EU RA of nickel to estimate nickel exposure concentrations or Predicted Environmental Concentrations (PEC) on local (PEClocal) and regional (PECregional) scales. The input data for calculating the PECregional are total nickel emissions from point and diffuse sources on a regional as well as on a continental scale. The continental area is in the Technical Guidance Document (TGD) defined as “Europe.” The regional area (generic region) is defined as 1) 10% of the continental area or 2) a typical densely populated EU-area located in Western Europe. This fact sheet describes how the total regional and continental nickel emissions were calculated in the EU RA of Ni.

In the EU RA, an iterative process is used to calculate nickel emissions, as shown in Figure 2. The quantification is based on the most appropriate method, dependent on the availability of accurate emission quantification methods, activity data, and emission factors.

2.1 IDENTIFICATION OF RELEVANT SOURCES

A first step in the development of the nickel emission inventory report is the identification of the sources of nickel that could result in releases to the environment. A long-list of potential emission sources is developed, based on an overview of the mass-flow of nickel.

The next step is the identification of the uses in which nickel could be released in the environment (air, surface water, soil). This evaluation is based the components listed below.

1. Assessment of existing emission databases (national and international):

• Pollutant Release and Transfer Registers from different countries
• International organizations developing and publishing emission inventories [e.g., EPER (European Pollutant Emission Register), E-PRTR (The European Pollutant Release and Transfer Register), HELCOM (the Helsinki Commission), OSPAR (the Oslo and Paris Convention), International Conference for the Protection of the Rhine, etc.]
• Inventory reports from other institutions/organizations

2. Experts from relevant stakeholder organizations

3. Assessment of available emission inventory guidelines:

• EMEP/CORINAIR (European Monitoring and Evaluation Programme/Core Inventory of Air Emissions) emission inventory guideline (EEA, 2009)
• AP42 Compilation of Air Pollutant Emission Factors (US EPA, 1995)
• Guidelines for the emission inventory in The Netherlands (http://www.emissieregistratie.nl, last accessed September 2013)
• Australian emission inventory guidebook (http://www.npi.gov.au/resource/national-pollutant-inventory-guide, last accessed September 2013)

4. Open literature

The outcome of this step is the identification of a list of emission sources, which are categorized in different groups (Table 1).

2.2 SELECTION OF APPROPRIATE EMISSION QUANTIFICATION METHODS

The next step in the development of an emission inventory report is to quantify emissions using a tiered approach, depending on the availability of the data. The following tiers are employed:

  • A detailed approach in which emissions are based on measured or modeled data.
  • A mid-tier approach in which emissions are calculated with the basic equation: E = A x EF (see Text Box 1).
  • A pragmatic approach where emissions are estimated as an extrapolation of data available or calculated for another region/scale.

In the detailed approach, emissions are measured or modeled, for instance, plant individual reporting of industrial emissions to E-PRTR or emission quantified based on a detailed sewage system model or road traffic model.

In the mid-tier approach, the basic equation (Text Box 1) comes from general guidance documents on setting up emission inventory reports, like EMEP/CORINAIR emission inventory guidebook (EEA, 2009).

Text Box 1
Tiered Approach to Quantify Emissions

E = A x EF x CF x DF

Where:

E = Emissions

A = Activity Data, expresses the extent to which a human activity takes place

EF = Emission Factor, the coefficient that quantifies the emission or removals of a metal/product/debris per unit of activity

CF = Concentration Factor, the concentration of the metal in the
product/debris

DF = Distribution Factor, the share emitted to different Distribution Factor distribution channels (surface water, air, soil, wastewater)


The pragmatic approach was used in cases where the activity data (e.g., fuel consumption, mileage, etc.) used in the mid-tier approach were not available for the region/scale for which an inventory needs to be developed. In such case, a linear relationship was assumed between the emission sources in question and another well-defined parameter. For instance, a linear relationship could be assumed between the emissions from marine shipping allocated to a specific port and the gross tonnage of goods transferred in that port instead of the fuel consumption (which is not available).

2.3 GATHERING OF DATA

The availability of data is the limiting factor for selection of the most appropriate emission quantification methods (e.g., detailed approach, mid-tier approach, pragmatic approach). Emission data (E), activity data (A), emission factors (EF), concentration factors (CF), and distribution factors (DF) were gathered from different sources:

  1. individual contact with emission inventory responsible in different EU countries;
  2. information/reports from international organizations and data-bases, such as the European Commission, the E-PRTR data-base, North Sea Conferences, OSPAR, HELCOM, ICPR (International Conference for the Protection of the Rhine), and EMEP/CORINAIR emission inventory guidelines;
  3. close cooperation of industry experts; and
  4. the open literature.

2.4 QUANTIFICATION OF EMISSIONS

Emissions of nickel are influenced by many dynamic factors, including production techniques, different fuel sources, and ranges of pollution controls. The variability of these factors spatially across the EU and over time make it difficult to quantify emissions with accuracy. Emissions are therefore estimated according to the approach described in Text Box 1. The quality of these variables can vary extensively, and quality codes were assigned to each variable according to internationally recognized protocols.

The overall assessment of the method is determined by the lowest quality score, given to the different parameters (activity, emission factor, distribution factor) used in the method. Based on this assessment, sources and quantification methodologies for which a targeted assessment is necessary (because of their importance and/or low quality quantification method) were identified. Ultimately, the quantification method with the highest quality score is selected for each source.

As an example, we can refer to Table 2, in which an overview is given of all methods used for each identified nickel emission source, to quantify the emissions. For the source entitled “residential heating” (located under the “Households” category in Table 2) a mid-tier approach was used based on the equation:

E = A x EF, where

E   = Emission
A   = Activity (fuel consumption for residential heating)
EF = Emission Factor (e.g., 0.07 g nickel/ton solid fuel used)

3.1 IDENTIFICATION OF RELEVANT SOURCES

Based on the approach described in Section 2.1 all relevant nickel emission sources were identified in the nickel EU RA (Table 1).

3.2 SELECTION OF APPROPRIATE EMISSION QUANTIFICATION METHODS

Following the general methodology described in Section 2.2, the appropriate emission quantification approach was selected for each identified source (Table 2).

3.3 GATHERING OF DATA

As indicated in Section 2.3, data gathering is the most important step in setting up an emission inventory. Many different sources need to be evaluated to select the appropriate data. Table 3 provides an overview of the most important sources of nickel for which activity data and emission factors were used to complete the emission estimation formulas.

3.4 QUANTIFICATION OF EMISSIONS

Total nickel emissions in the EU27 (defined as the “continental region”) to the air, water, and soil compartments are estimated as direct emissions from the source. The results are shown in Table 4 and Figure 3.

For the EU27, total nickel emissions are estimated at about 1,790 tons nickel/year (745 tons nickel/year to surface water, 612 tons nickel/year to air, and 433 tons nickel/year to soil). For the water compartment, the most important source categories are “waste management” and “industry.” Within the “waste management” category 83% of the emissions are the result of emissions from sewage treatment plants. Emissions to soil are almost exclusively a result of the use of manure and mineral fertilizers on agricultural soil. Traffic and industrial processes were identified as important sources for emissions to air. Within the category “traffic,” the biggest share in total nickel emissions are caused by the fuel combustion by ships.

The EU Risk Assessment process evaluates risk at both regional and continental scales, where the continental scale is built on emission for the EU 27. Emissions are extrapolated from the continental scale to the regional scale by assuming that a typical European region comprises 10% of continental emissions. This equates to about 180 tons nickel/year of which 74.5 tons nickel/year to surface water, 61.2 tons nickel/year to air, and 43.3 tons nickel/year to soil.

Another approach for estimating regional scale emissions is to calculate emissions for a well-characterized region that is representative of Europe as a whole. The Netherlands were selected because it meets the criteria defined by the EU for a typical region (i.e., 20 million inhabitants and 40,000 km²) and, furthermore, constitutes a country with significant information on diffuse uses and releases. The Netherlands is therefore an appropriate reference for checking and comparing diffuse releases.

The results from this estimation are shown in Table 5 and Figure 4. Total emissions in The Netherlands are about 124 tons nickel/year and thus significantly lower than the extrapolated regional emissions.

For The Netherlands, total releases per year are about 20 tons to surface water, 72 tons to air, and 32 tons to soil.

About 70% of the emissions to water relate to “waste management” sources, of which 70% can be allocated to “wastewater treatment” activities. About 20% is emitted by industry. Other sources are related to overflows and the emissions through separate sewage systems.

From the total emissions to air, 56% can be allocated to “industry,” of which 96% come from combustion processes. More specifically, 43% can be allocated to traffic emissions from shipping. The emissions to air in The Netherlands are higher than those determined by EU-27 extrapolation because of the importance of inland shipping in The Netherlands.

From the total nickel emissions to soil, about 97% can be allocated to agricultural sources, of which in particular about 50% from the use of mineral fertilizers, about 40% from the use of manure, and about 10% for the use of sewage sludge on agricultural soil.

This fact sheet presents the approach for quantifying regional and continental point and diffuse emissions, through a process of data gathering, selection of emission quantification methods, and estimating regional and continental emission data. The total EU27 nickel emissions and the regional emissions, calculated according to two scenarios [generic and selected (e.g., The Netherlands scenario)] are used as input data for the EUSES 2.0 model to calculate the regional predicted environmental concentrations (PEC) for different environmental compartments (e.g., air, surface water, sediment, agricultural soil, natural soil, and industrial soil).

The final report on the environmental risk assessment of nickel and nickel compounds can be retrieved from the following website:
http://echa.europa.eu/documents/10162/cefda8bc-2952-4c11-885f-342aacf769b3
(last accessed July 2015)

The opinion of the SCHER can be found at the following address:
http://ec.europa.eu/health/ph_risk/committees/04_scher/docs/scher_o_112.pdf 
(last accessed September 2013)

Denier van der Gon et al. 2009. Metal contents of diesel and petrol fuel sold on the European Market, TNO Report Final Draft submitted to CONCAWE.

Desmet, H. et.al. 2001. Bepaling van het huishoudelijk lozingsgedrag in Vlaanderen in het kader van de wetenschappelijke onderbouwing van de milieuheffing. EPAS nv, studie in opdracht van VMM. (Determination of municipal wastewater in Flanders in the framework of the environmental levies, study on behalf of VMM).

ECOLAS. 2005. Assessment of point and diffuse sources of nickel and nickel(compounds) as a basis for regional and continental exposure assessment. January Draft. Study commissioned by Nickel Producers Environmental Research Association, Durham, NC, USA.

EEA (European Environment Agency). 2009. Atmospheric emission inventory guidebook. Available at (last accessed September 2013):
http://www.eea.europa.eu/publications/emep-eea-emission-inventory-guidebook-2009

Elzenga et al. 1998. PROMISE: A scenario model to calculate emissions to surface water. Report nr 773003006. Report for RIVM/RIZA.

ENTEC UK Limited. 2001. Economic Evaluation of air quality targets for metals. Final Report to the European Commission. January 2001.

ERF (European Union Road Federation). 2011. Tenth Edition ERF 2011 European Road Statistics. Publication from the European Union Road Federation. Available at (last accessed September 2013):  
http://www.irfnet.eu/images/stories/Statistics/2011/ERF-2011-STATS.pdf

EURAS. 2005. Environmental Risk Assessment Ni metal and Ni compounds. Regional exposure assessment. Assessment of point and diffuse environmental sources of nickel and nickel compounds and PEC derivation (EUSES).

European Pollutant Emission Register (EPER). 2009. European Pollutant Emission Register. Data from 2004. Available at (last accessed September 2013):
http://www.eea.europa.eu/data-and-maps/data/eper-the-european-pollutant-emission-register-4

Eurostat. 2003. Agriculture Statistical Yearbook: data 1992-2001, detailed tables.

Eurostat. 2009. Yearly energy statistics. Publications for several years available at (last accessed September 2013): 
http://epp.eurostat.ec.europa.eu/portal/page/portal/publications/collections/statistical_books

International Fertiliser Industry Association (IFA). 2004. Nitrogen, phosphate and potash statistics 1973-1973/74 to 2001-2001/02. Available at (last accessed September 2013):
http://www.fertilizer.org/ifa/HomePage/STATISTICS

International Water Association (IWA). 2005. IWA Yearkbook. Available at (last accessed September 2013): 
http://www.iwapublishing.com/iwa-yearbook

Leygraf, C.; Wallinder, I.O., Pan, J.; Herting, G.; Midander, K. 2005. Release rates of alloy constituents from stainless steel. Division of Corrosion Science, KTH, Stockholm, Sweden. Presented at ISSF-9 Helsinki, May 13, 2005.

Milieu Ltd. and WRc. 2008. Environmental, economic, and social impacts of the use of sewage sludge on land. Report prepared for the European Commission, DG Environment under Study Contract DG ENV.G.4/ETU/2008/0076r.

The Pollutant Release and Transfer Register of The Netherlands (RTR NL). 2001. Available at (last accessed September 2013): 
http://www.emissieregistratie.nl

US EPA (U.S. Environmental Protection Agency). 1995. AP 42, Fifth Edition Compilation of Air Pollutant Emission Factors, Volume 1: Stationary Point and Area Sources. Available at (last accessed September 2013):
http://www.epa.gov/ttn/chief/ap42/oldeditions/5th_edition/ap42_5thed_orig.pdf

van Tilborg, W.J.M. 2004. Nonferrous metals balances in agricultural soils. Report no 0303.

Wallinder, I.O.; Lu, J.; Bertling, S.; Leygraf, C. 2002. Release rates of chromium and nickel from 304 and 316 stainless steel during urban atmospheric exposure—a combined field and laboratory study. Corrosion Science. Volume 44, Issue 10, Pages 2303-2319.

6.1 ADDITIONAL RESOURCES

Bonten and Groenenberg. 2008. Leaching of heavy metals from farmland and uncultivated land. Emission estimates for diffuse sources. Netherlands Emission Inventory. May.

Corrosion and Metals Research Institute. Publication year unknown. Tools for assessment of corrosion and soiling in the multipollutant situation.

Delahaye et al. 2003. Emissie van zeven zware metalen naar landbouwgrond (Emissions of seven heavy metals to agricultural soil). Centraal Bureau voor de Statistiek. Voorburg/Heerelen.

INERIS. 2009. Régistre Français des Emissions Polluants, INERIS. Available at (last accessed September 2013): 
http://www.pollutionsindustrielles.ecologie.gouv.fr/IREP/index.php

NAEI (National Atmospheric Emission Inventory). 2009. The National Atmospheric Emission Inventory of the UK. Available at (last accessed September 2013):
http://www.naei.org.uk

Römkens, P. and Rietra, R.P. 2008. Heavy metals and nutrients in manure in the Netherlands. Final Report: ALTERRA.

Umweltbundesamt. 2009. Nickel emissions to air in Germany during 1990-2007. Available at (last accessed September 2013):
http://www.naei.org.uk

* Some rights reserved by photographer Safia Osman. http://www.flickr.com/photos/so8/8161891893/sizes/h/in/photolist-dreQ72-cAqR8q-mKRHP-yhBjF-dNmAvF-e3sRdV-75yL2T-8Kxvqv-e9U2FQ-3dNdk8-6wKpKd-9G6Yig-3FMJyY-8yCPky-8ASuK4-5bJUX9-4xbcay-cGQxXo-5bECwe-4WwjLV-85M9s6-5SGoK-6SCr3L-4ik3Tn-d4SkrC-5GfPd-29q76c-5bhrUY-ahtoft-aqPKpc-br1hAC-bdhD6-3kQnEa-5eCiaw-5eCifu-a7HxNK-9DnUVo-axXLQ1-a7Lr1j-4VbwST-549DjK-psDeG-7dzfL4-4ESjFL-3gwUwM-8SP5M9-2tVX7c-2u1pm1-cGejvm-pDP3w-3wpbaq/ (last accessed September 2013)

Back to top